Kotlin Notebookでサポートされている出力形式
Kotlin Notebookは、テキスト、HTML、画像など、さまざまな出力タイプをサポートしています。外部ライブラリを使用することで、出力オプションを拡張し、チャートやスプレッドシートなどでデータを可視化できます。
各出力は、Jupyter MIMEタイプを何らかのデータにマッピングするJSONオブジェクトです。このマップから、Kotlin Notebookは他のタイプの中で最も優先度の高いサポート対象のMIMEタイプを選択し、以下のようにレンダリングします:
- テキストは
text/plainMIMEタイプを使用します。 - BufferedImageクラスは、Base64文字列にマッピングされた
image/pngMIMEタイプを使用します。 - ImageクラスおよびLaTeX形式は、内部に
imgタグを持つtext/htmlMIMEタイプを使用します。 - Kotlin DataFrameテーブルおよびKandyプロットは、静的なHTMLまたは画像に基づいた独自の内部MIMEタイプを使用します。これにより、GitHub上でも表示できます。
手動でマッピングを設定することもできます。例えば、Markdownをセルの出力として使用する場合:
MimeTypedResult(
    mapOf(
        "text/plain" to "123",
        "text/markdown" to "# HEADER",
        // その他の mime:value ペア
    )
)あらゆる種類の出力を表示するには、DISPLAY() 関数を使用します。また、複数の出力を組み合わせることも可能です:
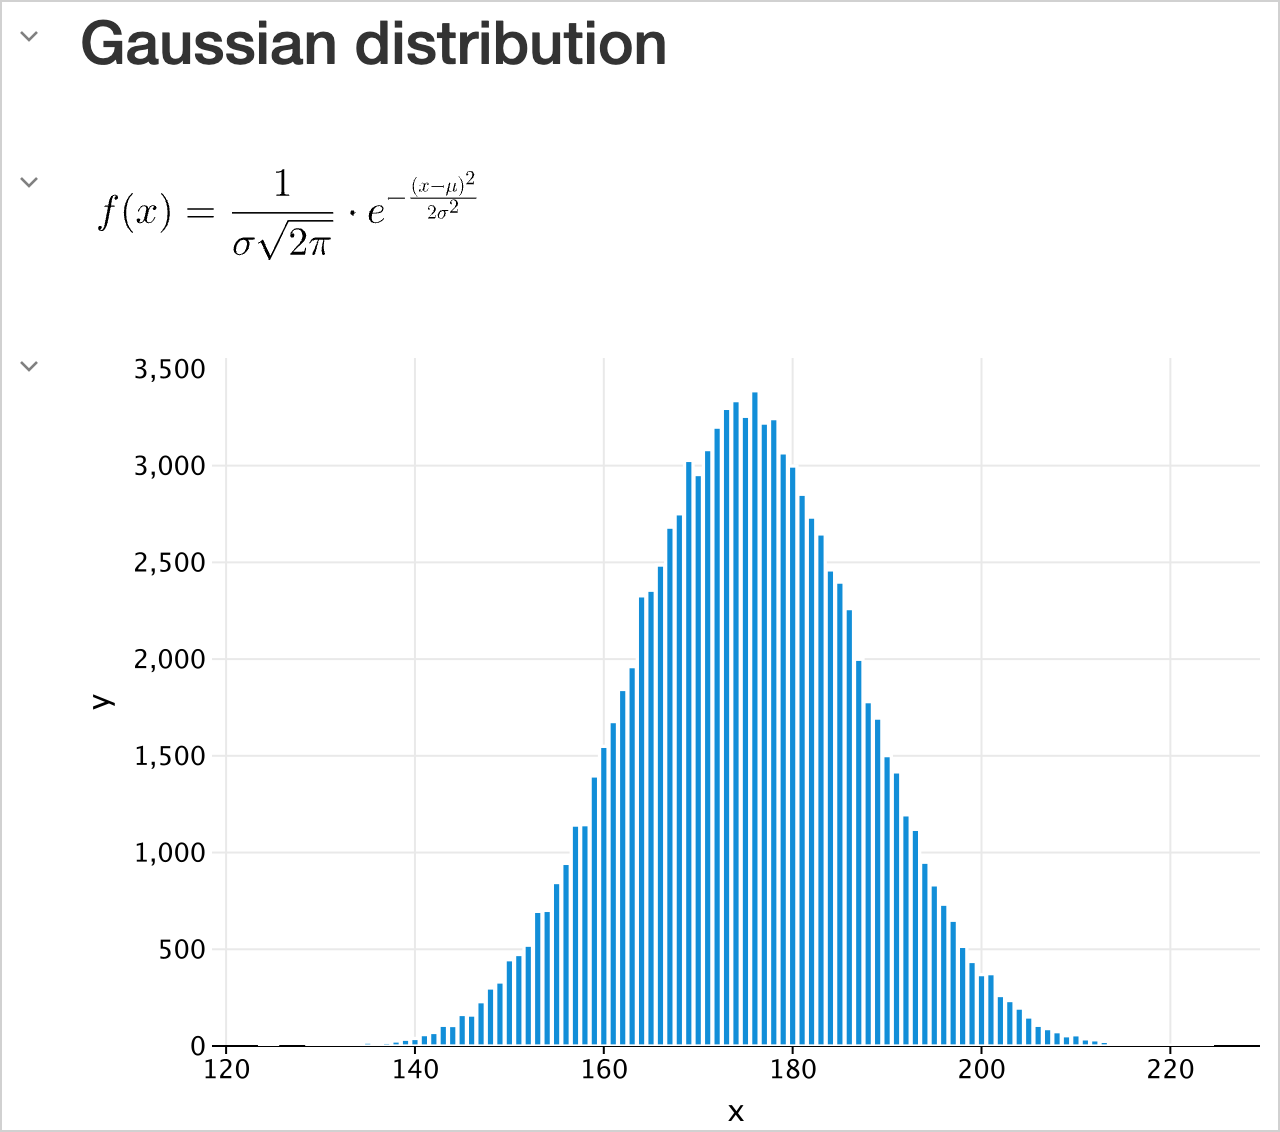
DISPLAY(HTML("<h2>Gaussian distribution</h2>"))
DISPLAY(LATEX("f(x) = \\frac{1}{\\sigma \\sqrt{2\\pi}} \\cdot e^{-\\frac{(x - \\mu)^2}{2\\sigma^2}}"))

val experimentX = experimentData.map { it.key }
val experimentY = experimentData.map { it.value }

DISPLAY(plot {
    bars {
        x(experimentX)
        y(experimentY)
    }
})
テキスト
プレーンテキスト
最もシンプルな出力タイプはプレーンテキストです。これは、print文、変数の値、またはコードからのテキストベースの出力で使用されます:
val a1: Int = 1
val a2: Int = 2
var a3: Int? = a1 + a2

"My answer is $a3"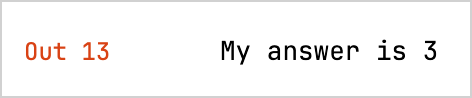
- セルの結果がどの出力タイプとしてもレンダリングおよび表示できない場合、
toString()関数を使用してプレーンテキストとして出力されます。 - コードにエラーが含まれている場合、Kotlin Notebookはエラーメッセージとトレースバックを表示し、デバッグのための情報を提供します。
リッチテキスト
リッチテキストを使用するには、Markdownタイプのセルを選択します。これにより、リスト、テーブル、フォントスタイル、コードブロックなどを使用して、MarkdownやHTMLマークアップでコンテンツをフォーマットできます。HTMLにはCSSスタイルやJavaScriptを含めることができます。
## ラインマジック

| マジック                             | 説明                                                                                                              | 例                                                                                    |
|------------------------------------|------------------------------------------------------------------------------------------------------------------|---------------------------------------------------------------------------------------|
| <code>%use</code>                  | サポートされているライブラリのコードを注入します:アーティファクト解決、デフォルトのインポート、初期化コード、型レンダラー。 | <code>%use klaxon(5.5), lets-plot</code>                                              |
| <code>%trackClasspath</code>       | 現在のクラスパスの変更をログに記録します。アーティファクト解決の失敗をデバッグするのに役立ちます。                        | <code>%trackClasspath [on |off]</code>                                                |
| <code>%trackExecution</code>       | 実行されるコードの断片をログに記録します。ライブラリサポートのデバッグに役立ちます。                                     | <code>%trackExecution [all|generated|off]</code>                                      |
| <code>%useLatestDescriptors</code> | 利用可能な最新バージョンのライブラリ記述子を使用します。デフォルトでは、バンドルされた記述子が使用されます。              | <code>%useLatestDescriptors [on|off]</code>                                           |
| <code>%output</code>               | 出力キャプチャの設定を行います。                                                                                 | <code>%output --max-cell-size=1000 --no-stdout --max-time=100 --max-buffer=400</code> |
| <code>%logLevel</code>             | ログレベルを設定します。                                                                                           | <code>%logLevel [off|error|warn|info|debug]</code>                                    |

<ul><li><a href="https://github.com/Kotlin/kotlin-jupyter/blob/master/docs/magics.md">ラインマジックの詳細についてはこちら</a>。</li>
<li><a href="https://github.com/Kotlin/kotlin-jupyter/blob/master/docs/magics.md">サポートされているライブラリの全リストはこちら</a>。</li></ul>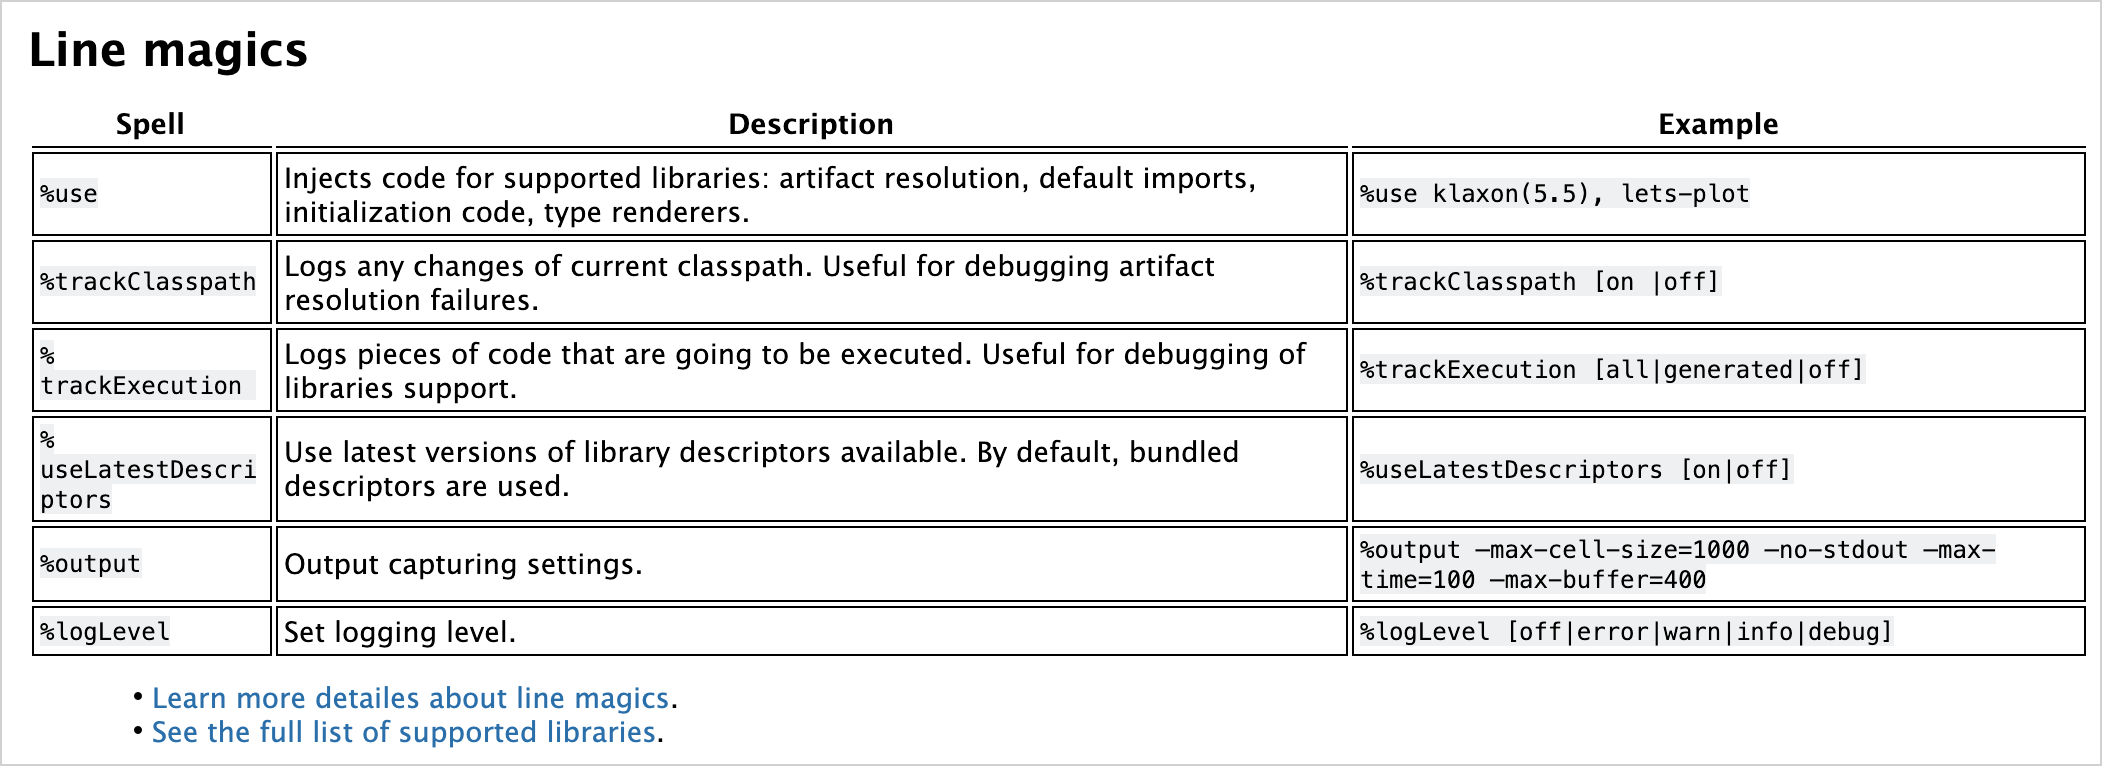
HTML
Kotlin NotebookはHTMLを直接レンダリングでき、スクリプトを実行したり、ウェブサイトを埋め込んだりすることも可能です:
HTML("""
<p>Counter: <span id="ctr">0</span> <button onclick="inc()">Increment</button></p>
<script>
    function inc() {
        let counter = document.getElementById("ctr")
        counter.innerHTML = parseInt(counter.innerHTML) + 1;
}
</script>
""")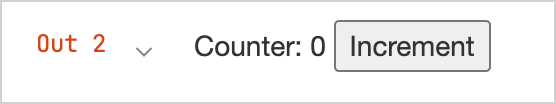
スクリプトを実行できるようにするには、ファイルの先頭でノートブックを Trusted(信頼済み)としてマークしてください。
画像
Kotlin Notebookでは、ファイルからの画像、生成されたグラフ、またはその他のビジュアルメディアを表示できます。静止画像は .png、jpeg、.svg などの形式で表示できます。
BufferedImage
デフォルトでは、BufferedImage クラスを使用して画像を表示できます:
import java.awt.Color
import java.awt.image.BufferedImage

val width = 300
val height = width

val image = BufferedImage(width, height, BufferedImage.TYPE_INT_ARGB)

val graphics = image.createGraphics()
graphics.background = Color.BLACK
graphics.clearRect(0, 0, width, height)
graphics.setRenderingHint(
    java.awt.RenderingHints.KEY_ANTIALIASING,
    java.awt.RenderingHints.VALUE_ANTIALIAS_ON
)
graphics.color = Color.WHITE
graphics.fillRect(width / 10, height * 8 / 10, width * 10 / 20, height / 10)
graphics.dispose()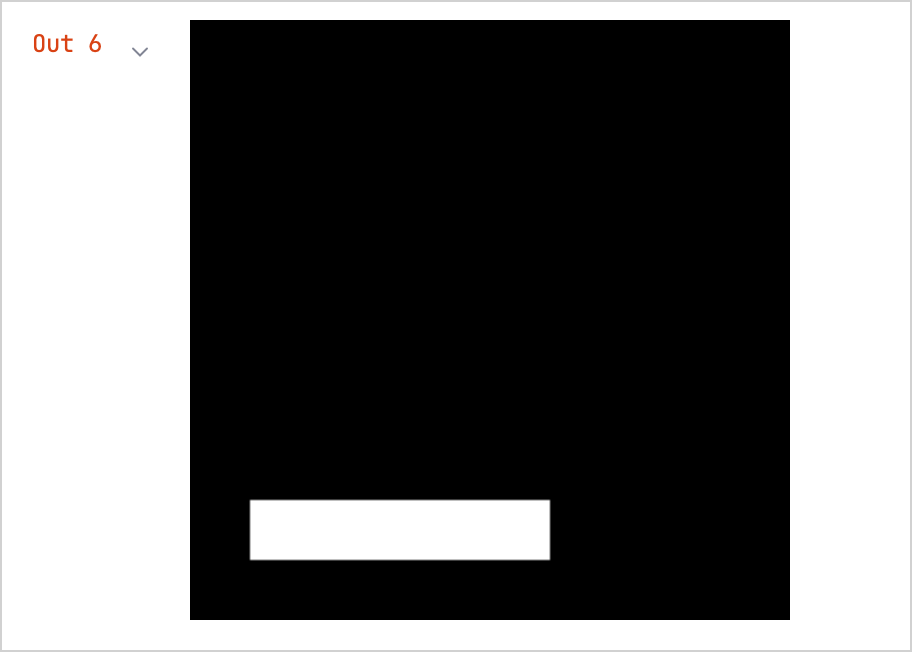
読み込まれた画像
lib-ext ライブラリを使用すると、標準のJupyter機能を拡張し、ネットワークから読み込まれた画像を表示できます:
%use lib-ext(0.11.0-398)Image("https://kotlinlang.org/docs/images/kotlin-logo.png", embed = false).withWidth(300)
埋め込み画像
ネットワークから読み込まれる画像の欠点は、リンクが切れたりネットワーク接続が失われたりすると画像が表示されなくなることです。これを回避するには、埋め込み画像を使用します。例:
val kotlinMascot = Image("https://blog.jetbrains.com/wp-content/uploads/2023/04/DSGN-16174-Blog-post-banner-and-promo-materials-for-post-about-Kotlin-mascot_3.png", embed = true).withWidth(400)
kotlinMascot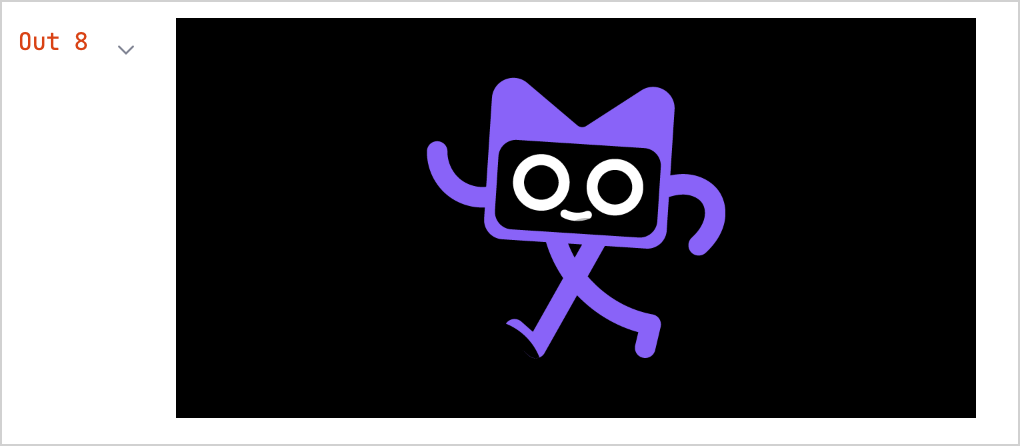
数式と方程式
アカデミアで広く使用されている組版システムであるLaTeX形式を使用して、数式や方程式をレンダリングできます:
Jupyterカーネルの機能を拡張する
lib-extライブラリをノートブックに追加します:none%use lib-ext(0.11.0-398)新しいセルで、数式を実行します:
noneLATEX("c^2 = a^2 + b^2 - 2 a b \\cos\\alpha")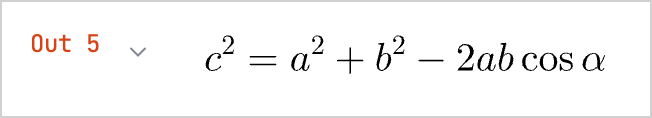
データフレーム
Kotlin Notebookでは、データフレームを使用して構造化データを可視化できます:
Kotlin DataFrame ライブラリをノートブックに追加します:
none%use dataframeデータフレームを作成し、新しいセルで実行します:
kotlinval months = listOf( "January", "February", "March", "April", "May", "June", "July", "August", "September", "October", "November", "December" ) // さまざまな製品および月の売上データ: val salesLaptop = listOf(120, 130, 150, 180, 200, 220, 240, 230, 210, 190, 160, 140) val salesSmartphone = listOf(90, 100, 110, 130, 150, 170, 190, 180, 160, 140, 120, 100) val salesTablet = listOf(60, 70, 80, 90, 100, 110, 120, 110, 100, 90, 80, 70) // Month(月)、Sales(売上)、Product(製品)の列を持つデータフレーム val dfSales = dataFrameOf( "Month" to months + months + months, "Sales" to salesLaptop + salesSmartphone + salesTablet, "Product" to List(12) { "Laptop" } + List(12) { "Smartphone" } + List(12) { "Tablet" }, )データフレームは
dataFrameOf()関数を使用しており、12か月間に販売された製品(ノートパソコン、スマートフォン、タブレット)の数を含んでいます。例えば、最も売上高が高かった製品と月を見つけるなど、フレーム内のデータを探索します:
nonedfSales.maxBy("Sales")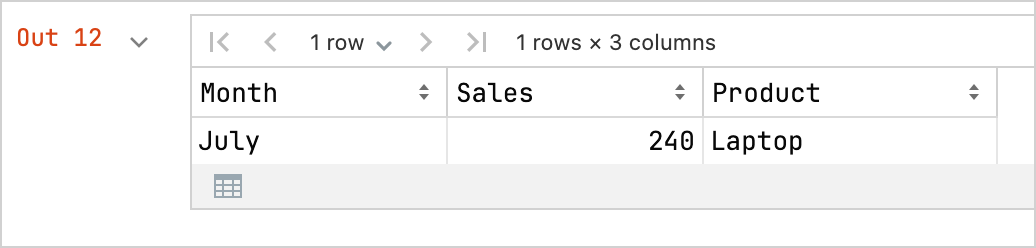
データフレームをCSVファイルとしてエクスポートすることもできます:
kotlin// データをCSV形式でエクスポート dfSales.writeCSV("sales-stats.csv")
チャート
Kotlin Notebook内で直接さまざまなチャートを作成して、データを可視化できます:
Kandy プロットライブラリをノートブックに追加します:
none%use kandy同じデータフレームを使用し、新しいセルで
plot()関数を実行します:kotlinval salesPlot = dfSales.groupBy { Product }.plot { bars { // X軸とY軸に使用されるデータフレームの列にアクセス x(Month) y(Sales) // カテゴリに使用されるデータフレームの列にアクセスし、それらのカテゴリに色を設定 fillColor(Product) { scale = categorical( "Laptop" to Color.PURPLE, "Smartphone" to Color.ORANGE, "Tablet" to Color.GREEN ) legend.name = "Product types" } } // チャートの外観をカスタマイズ layout.size = 1000 to 450 layout.title = "Yearly Gadget Sales Results" } salesPlot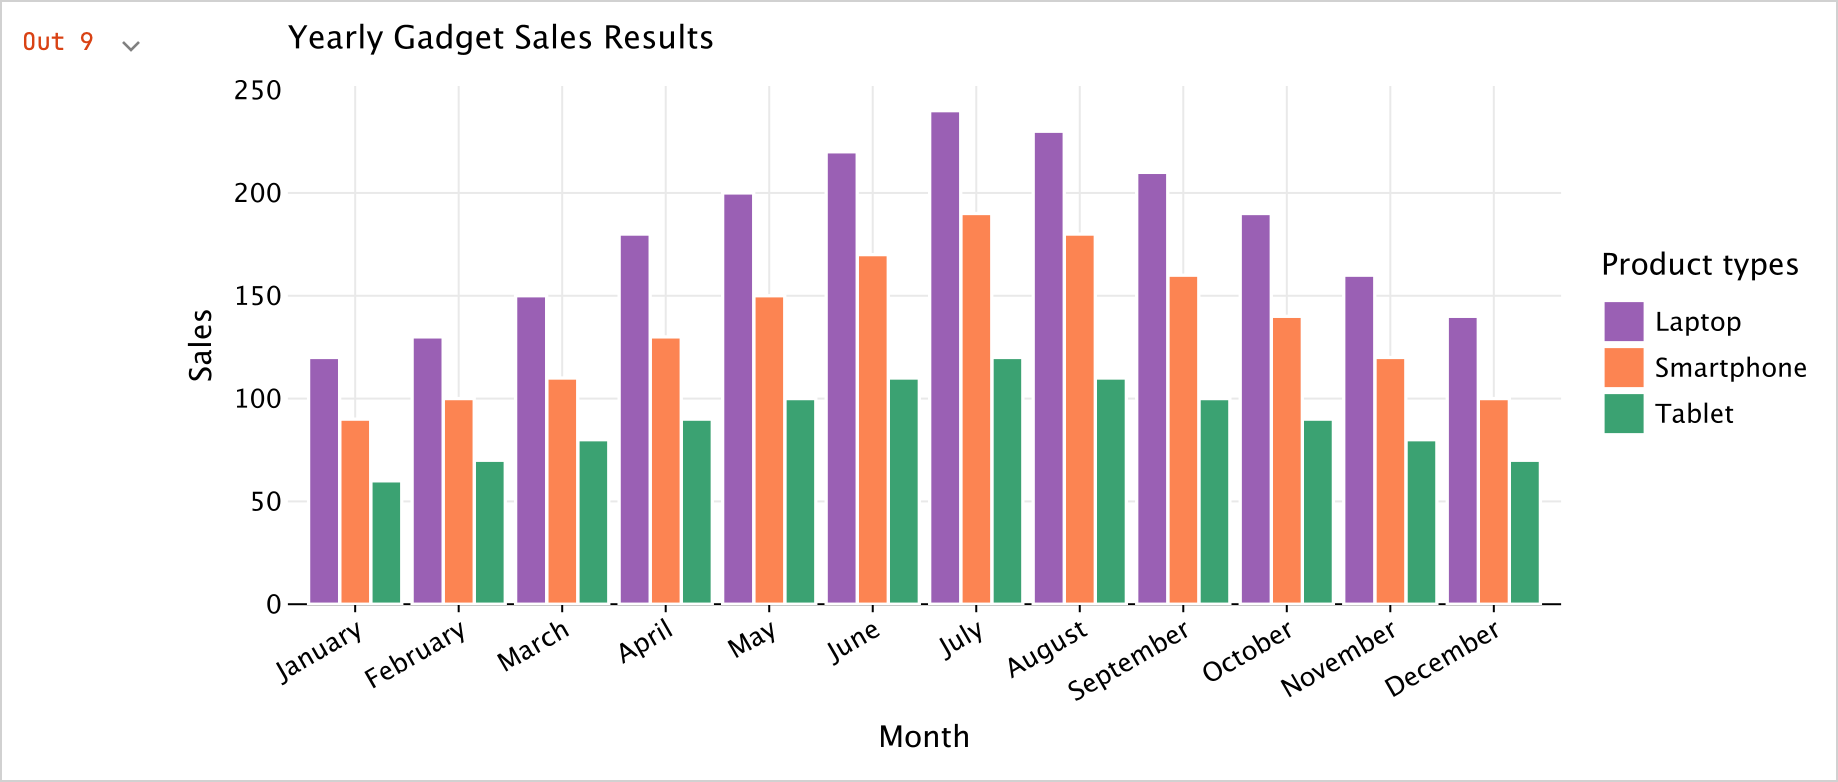
プロットを
.png、jpeg、.html、または.svg形式でエクスポートすることもできます:kotlin// プロットファイルの出力形式を指定: salesPlot.save("sales-chart.svg")